 When talking about constructing an investment portfolio, you’ll often hear about diversification and buying low-correlation or non-correlated assets.
- A positive correlation means that the assets tended to move in the same direction. A value of 1 is perfect positive correlation.
- A negative correlation means that they tended to move in opposite directions. A value of -1 is perfect negative correlation.
- A zero correlation means that they had no relationship.
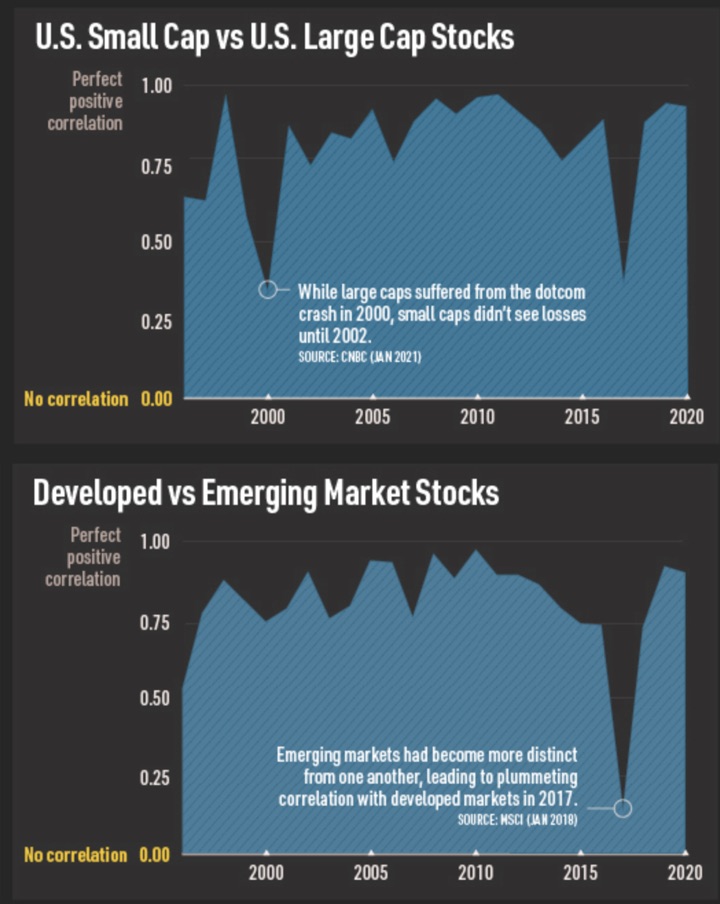
Visual Capitalist has a nice infographic of a few . Specifically, they charted the 1-year correlation based on monthly returns.
We see that US Large Cap and US Small Cap stocks are highly correlated historically, as are Developed and Emerging Market stocks. Even though each basket may contain completely different businesses doing different things and even located in different parts of the world, they still contain businesses and thus tend to move together in the same direction. Of course, a Nobel Prize-winning discovery was that as long as assets aren’t perfectly correlated (a value of 1), you still get some amount of diversification benefit from owning different asset classes. For example, owning both US and International stocks still helps diversify your portfolio even if they tend to go up or down together.
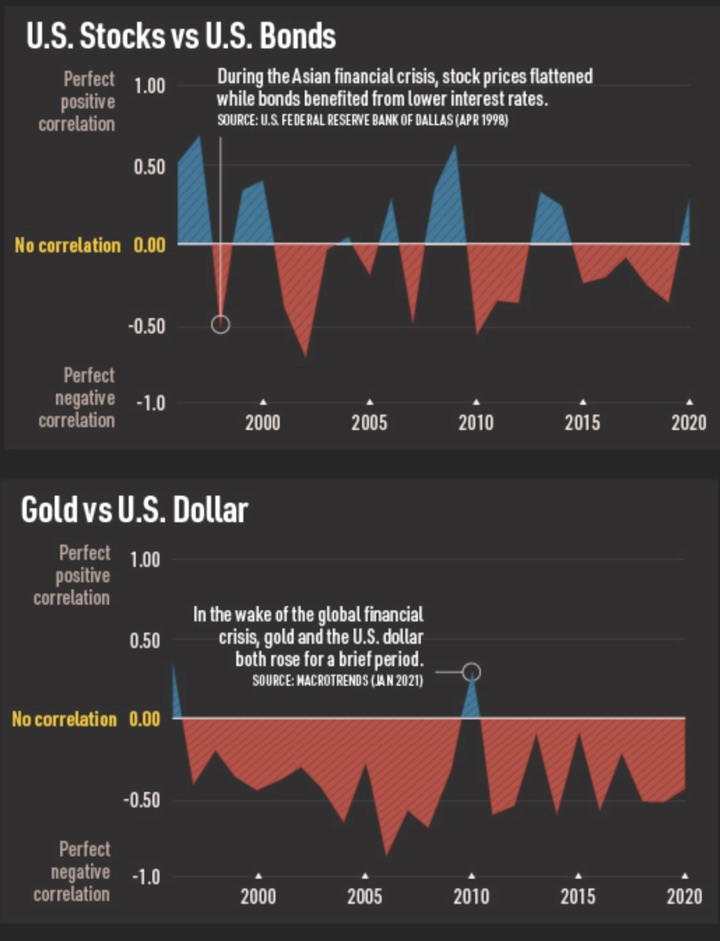
Meanwhile, the relationship between US stocks and US bonds have a low correlation. Although it’s not always negative, it has been negative 14 out of the last 25 years. As stocks and bonds don’t reliably move together, this offers a more impactful diversification benefit to your portfolio. In addition, investment-grade bonds tend not to move as much in general and thus can serve as a stable ballast to your portfolio. (Note that the last chart is Gold vs. US dollar, not US stocks.)
Here is another post on with data from Morningstar.
“The editorial content here is not provided by any of the companies mentioned, and has not been reviewed, approved or otherwise endorsed by any of these entities. Opinions expressed here are the author’s alone. This email may contain links through which we are compensated when you click on or are approved for offers.”
from .
Copyright © 2004-2021 MyMoneyBlog.com. All Rights Reserved. Do not re-syndicate without permission.