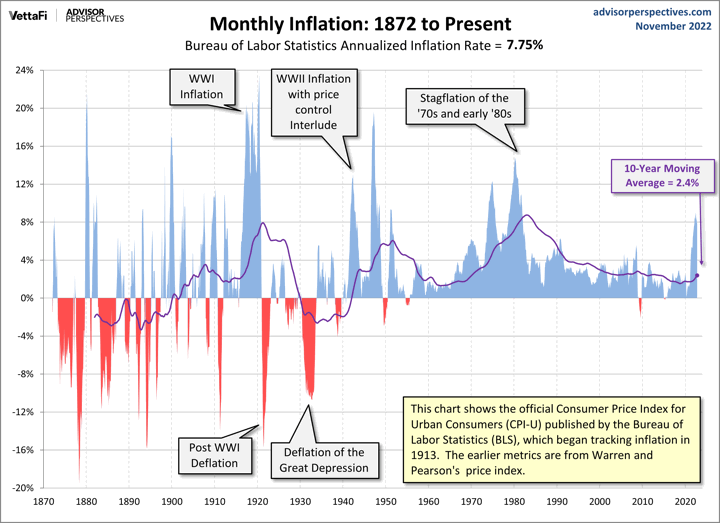
Advisor Perspectives has a nice chart of (1872-2022). I appreciate that it includes both the short-term monthly inflation numbers as well as the 10-year rolling average over this long period of time.
A few basic observations:
- From a long-term perspective, there have been many large sharp spikes in inflation throughout the entire period. Inflation has been a persistently recurring concern.
- From roughly 1872-1940, there were extreme swings between both high inflation and high deflation. Of course, this was also when the dollar was (mostly) on the gold standard.
- From roughly 1950 onward, the rolling 10-year average for inflation has still varied from ~2% to ~9% annually. Given our current low 10-year average, inflation could continue to be elevated for many years and not look out of place on this chart.
My primary takeaway is to always stay mindful of long-term inflation risk. I don’t know what inflation will be next month or next year, but I am confident that it’s coming sooner or later. Some applications (my opinion):
- The 30-year fixed rate mortgage continues to be a great inflation hedge. (Even at high interest rates, that might soon result in lower prices.) As long as you lock in a monthly payment that you can comfortably afford and plan to stay a while, your monthly mortgage payment will only effectively get cheaper over time as inflation eats away at it. If rates drop, you can refinance. If rates rise, you can keep it forever and even rent the property out if you move, as high rates means inflation likely boosted rents while your mortgage payment stayed the same.
- On the flip side, according to , the a 30-year Treasury bond yielded only 1% a year back in 2020. Long-term nominal bonds became a popular portfolio diversifier while rates were dropping (performance chasing), but in reality they became a ticking inflation bomb. I’m still avoiding long-term nominal bonds today.
- A lifetime annuity has definite upsides, but inflation will eat away at the spending power over what could be 30 years. Maybe you’ll get older and spend less each year anyway, but I’d still maintain other assets (like stocks) to hedge that inflation risk. I like single premium immediate annuities as a possible tool for retirement income, but not as the only or primary tool.
- TIPS are complex yet . I’m still not sure what the best play is right now, but I am happy to keep holding them as part of my bond portfolio. I’m leaning towards moving away from ETFs and more towards a ladder of individual bonds, especially if the real rates on long-term TIPS go any higher.
“The editorial content here is not provided by any of the companies mentioned, and has not been reviewed, approved or otherwise endorsed by any of these entities. Opinions expressed here are the author’s alone. This email may contain links through which we are compensated when you click on or are approved for offers.”
from .
Copyright © 2004-2022 MyMoneyBlog.com. All Rights Reserved. Do not re-syndicate without permission.
Related Posts